Cut LCP to 2.5s: 5-step Website Speed Optimization for Developers


Website speed optimization means measuring how fast your pages load for real users, then fixing the highest-impact bottlenecks first. Run PageSpeed Insights now to get lab and field Core Web Vitals for mobile and desktop. Aim for LCP at or under 2.5 seconds, INP under 200 milliseconds, and CLS under 0.1. Everything past this point is refinement.
TL;DR:
- Improving server response time by upgrading hosting and PHP, especially reducing TTFB under 600 milliseconds, yields the largest initial speed gains.
- Fixing cache and CDN setup, including server-level caching and edge networks like Cloudflare, significantly decreases repeated load work and boosts LCP.
- Prioritize reducing large image sizes, resizing, converting to WebP or AVIF, and preloading critical assets before tackling third-party scripts or font loading issues.
- Focus on mobile-specific speed factors by serving appropriately sized images, testing throttled connections, and reducing JavaScript execution for better responsiveness.
- Regularly monitor real-user data with web-vitals and Search Console, rather than relying solely on lab scores, to prevent silent regressions in speed metrics.
Table of Contents
- Which tools should you run first to measure site speed?
- What are Core Web Vitals, and which one matters most?
- What order should you fix speed problems in?
- WordPress speed checklist: what to fix and in what order
- How do you monitor speed and stop it from regressing?
- Why speed work never really finishes
- Advanced compression: Brotli and WebP explained
- Lazy loading images and iframes without hurting LCP
- Mobile speed: what changes and what to fix differently
- Does switching to HTTP/2 or HTTP/3 speed up your site?
- How should you deliver web fonts without slowing things down?
- The part of speed optimization most guides skip
- Get a performance audit from an experienced business technology consulting firm
- Sources
- FAQ
Which tools should you run first to measure site speed?
Start with PageSpeed Insights. It gives you two data sets in one report: a lab score generated on the spot, and field data pulled from the Chrome User Experience Report (CrUX) if your site has enough traffic. The lab score tells you what happens under controlled conditions. The field data tells you what real visitors on real networks and real devices actually experienced last month. When those two numbers disagree, the field data wins, because it reflects actual users rather than a single test run.
GTmetrix and WebPageTest go deeper. Both generate a waterfall chart and a filmstrip, so you can watch exactly when each resource loads and see the page render frame by frame. This is where you catch the request that takes 900 milliseconds to respond, or the third render-blocking stylesheet nobody remembers adding.
Chrome DevTools, specifically the Performance panel, is for runtime profiling. It shows you main-thread activity, long tasks, and exactly which script is stealing input responsiveness.
When you open any report, read in this order:
- Time to First Byte (TTFB): server response time before anything renders
- LCP and CLS scores, plus INP or Total Blocking Time as its lab proxy
- The waterfall for slow or blocking requests
- Any third-party script flagged as blocking the main thread
What are Core Web Vitals, and which one matters most?
Core Web Vitals are the three field metrics Google uses to judge loading speed, interactivity, and visual stability. Google’s own guidance sets the thresholds: LCP at 2.5 seconds or less, INP under 200 milliseconds, and CLS under 0.1.
Core Web Vitals thresholds: LCP ≤ 2.5s (loading), INP < 200ms (responsiveness), CLS < 0.1 (visual stability) — all measured at the 75th percentile of visits, across mobile and desktop separately.
That 75th percentile detail trips people up. Google doesn’t grade your average visitor. It grades the experience of your slower 25%, which means a fast connection at your office tells you nothing about the person on a mid-range phone with patchy mobile data. That’s why lab proxies like First Contentful Paint (FCP) and Total Blocking Time (TBT) are useful for testing changes before launch, but field data from real visitors is the metric that decides your search performance. To capture that field data yourself instead of waiting on Search Console, install the web-vitals library and send readings straight to your analytics.
What order should you fix speed problems in?
Fixing things randomly wastes time, because a caching plugin can’t rescue a server that takes four seconds to respond, and a CDN can’t fix bloated JavaScript. Work through bottlenecks in the order they actually block rendering.
- Server response time (TTFB). Run a lab test and check TTFB in isolation. Anything over 600 milliseconds usually points to underpowered hosting, an outdated PHP version, or missing OPcache. Upgrading to managed hosting with a current PHP release commonly cuts TTFB by several hundred milliseconds on its own.
- Caching and a CDN. Server-level page caching, a Redis object cache, and an edge CDN like Cloudflare are usually the single biggest recurring win once TTFB is under control, because they remove repeat work from the server entirely.
- LCP asset work. Resize and convert your largest image, add a
preloadhint for it, and set explicit width and height so the browser doesn’t guess. - Main-thread work. Defer non-critical JavaScript, inline the CSS needed for the first screen, and cut third-party scripts and tag managers down to what you actually use.
- Layout stability. Set fixed dimensions on every image, video, and ad slot, and load fonts with
font-display: swapso text doesn’t jump when a custom font finishes loading.
Pro Tip: Fix server and caching issues before touching a single image. Developers who jump straight to image compression on a slow server often see almost no LCP improvement, because the bottleneck was never the image.
WordPress speed checklist: what to fix and in what order
WordPress sites hide their worst bottlenecks in the database, not the theme. Work through this list roughly top to bottom:
- Move to managed WordPress hosting running PHP 8.x with OPcache enabled. This alone raises the ceiling on everything else you do.
- Audit your plugins. Every plugin adds queries, scripts, and stylesheets, whether or not the page uses them.
- Check autoloaded options in
wp_options. Bloated autoloaded data past roughly 800kb is a common, invisible cause of slow TTFB, and most site owners never look there. - Remove stale transients and clean up post revisions clogging the database.
- Convert images to WebP or AVIF with proper
srcset, but avoid lazy-loading the LCP image itself. - Install Query Monitor to see slow database queries in real time, and add a Redis object cache if your host supports it.
- Choose a plugin like WP Rocket or LiteSpeed Cache only if your host doesn’t already manage caching server-side. Running both a plugin cache and a host-level cache usually causes conflicts, not gains.
How do you monitor speed and stop it from regressing?
Combine lab snapshots with real-user monitoring using the web-vitals library feeding your analytics, plus Search Console’s Core Web Vitals report for a longer-term field view.
- Add a Lighthouse check to your CI pipeline with a performance budget that fails the build if LCP or CLS regresses.
- Run a full manual audit monthly, not just after a redesign.
- Set alerts for Core Web Vitals dropping out of the “Good” band in Search Console.
- Store LCP, INP, and CLS per page path from web-vitals, so you can trace a regression to the exact template that broke.
Why speed work never really finishes
Every site we’ve audited had at least one “fixed” page quietly regress within a few months, usually from a new plugin, an added tracking script, or a redesigned hero banner. Fixing things out of order wastes the most time we see: teams polish images for weeks while a slow server caps every other gain. Bring in outside help when TTFB stays stubbornly high after a hosting change, when a JavaScript-heavy front end resists simple fixes, or when nobody on the team has the hours to run monthly audits. A proper engagement runs an audit, applies fixes in priority order, then hands over monitoring.
Advanced compression: Brotli and WebP explained
Brotli compresses text-based assets, HTML, CSS, and JavaScript, roughly 15 to 20% smaller than Gzip at the same setting. Most modern hosts and CDNs, including Cloudflare, support it by default, but confirm it’s active by checking the content-encoding: br response header in DevTools’ Network tab. If your host doesn’t offer it, Gzip level 6 is still a reasonable fallback.
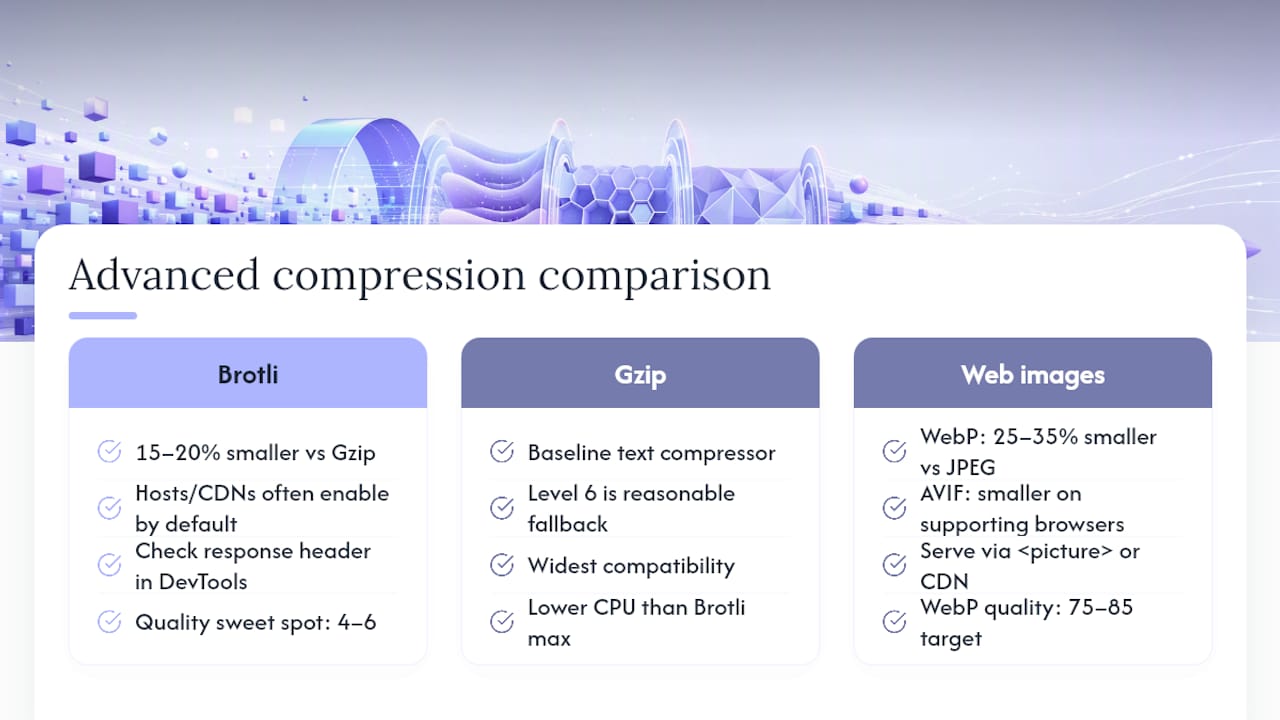
Images are a separate problem, and WebP or the newer AVIF format solve it better than any compression setting applied to a JPEG. WebP typically shrinks photographic images 25 to 35% smaller than an equivalent-quality JPEG, and AVIF pushes that further still on supporting browsers. Serve these formats through a <picture> element with JPEG as the fallback, or let a CDN’s automatic image transformation handle format negotiation per browser.
Configuration matters as much as the format choice. Set your compression level, Brotli quality 4 to 6 for dynamic pages is usually the sweet spot between CPU cost and size savings, since maximum compression (level 11) can add noticeable server load for barely any extra reduction. For images, target WebP quality settings between 75 and 85. Below that range, visible artifacts start appearing on photos with fine detail or gradients. Above it, you’re paying in file size for savings nobody notices.
One thing to check either way: confirm your CDN or server isn’t double-compressing already-compressed images, which wastes CPU cycles for zero benefit.
Lazy loading images and iframes without hurting LCP
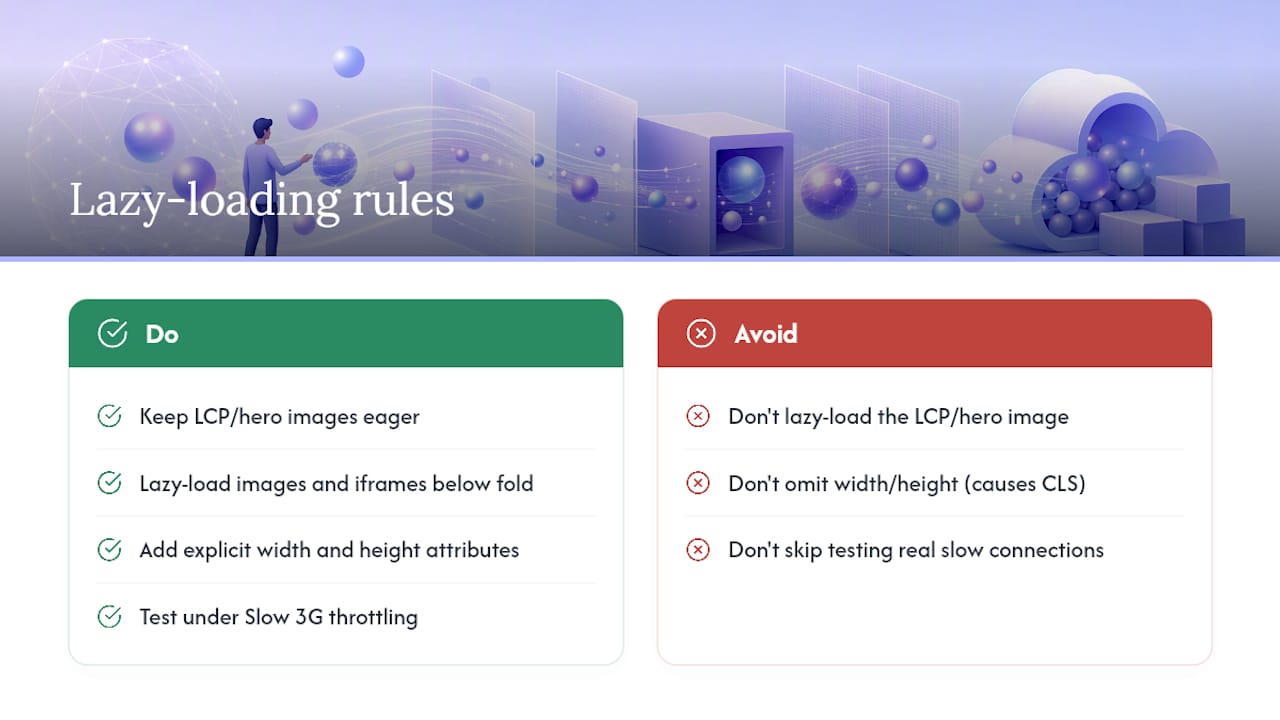
Lazy loading delays offscreen images and iframes until the visitor scrolls near them, which cuts initial page weight and speeds up everything above the fold. The native implementation needs no library: add loading="lazy" to any <img> or <iframe> tag below the first screen.
The mistake almost every site makes: lazy-loading the hero image or LCP element itself. Do that, and you’ve told the browser to delay loading the exact resource Google measures for your LCP score, which can push that metric well past the 2.5 second threshold. The rule is simple: anything visible without scrolling loads eagerly (or doesn’t get a loading attribute at all, since eager is the default). Everything below the fold gets loading="lazy".
For iframes, embedded YouTube videos, maps, and ad units, lazy loading matters even more, since these often load an entire secondary page’s worth of scripts and stylesheets. A map embed with a dozen unlazy-loaded iframes can add a full second to TTFB-adjacent load time on a content-heavy page.
Two more details worth getting right. First, always pair lazy loading with explicit width and height attributes, so the browser reserves space before the image loads and avoids a CLS penalty when it finally appears. Second, test on a genuinely slow connection, throttled to “Slow 3G” in Chrome DevTools, because lazy loading implemented carelessly can cause visible pop-in that looks worse than a slightly slower initial load.
Mobile speed: what changes and what to fix differently
Mobile visitors face a different set of constraints than desktop ones, and treating mobile as “the same site, smaller screen” is where most mobile-specific slowdowns come from. Processing power, network latency, and screen size all work against you simultaneously.
CPU matters more on mobile than most developers assume. A mid-range Android device can take three to four times longer to parse and execute the same JavaScript bundle than a desktop machine. That’s why heavy client-side rendering frameworks tend to show their worst INP numbers specifically on mobile field data, even when desktop scores look clean.
Network conditions compound the problem. Mobile connections routinely see higher latency and more variable throughput than home broadband, which makes every additional request, every font file, every third-party script, cost more in real load time than the same request would on desktop.
Practical mobile-specific fixes:
- Serve appropriately sized images for mobile viewports using
srcset, rather than shipping a desktop-width image and letting CSS scale it down. - Test with mobile-specific throttling in Chrome DevTools or PageSpeed Insights’ mobile report, not just the desktop tab.
- Audit tap targets and viewport configuration; a broken mobile viewport can trigger layout shifts that never show up on desktop.
- Reduce JavaScript execution specifically, since mobile CPUs feel main-thread bloat far more than desktop CPUs do.
Since Google’s Core Web Vitals field data is reported separately for mobile and desktop, a site can pass comfortably on one and fail on the other, so check both every time you audit.
Does switching to HTTP/2 or HTTP/3 speed up your site?
HTTP/2 and HTTP/3 both remove bottlenecks baked into how older HTTP/1.1 connections handle multiple requests. Under HTTP/1.1, browsers open a limited number of parallel connections per domain, which is why bundling and sprite sheets became standard practice for years. HTTP/2 multiplexes many requests over a single connection, so that workaround stops being necessary and can even hurt, since combining every asset into one giant bundle now works against the protocol’s strengths.
HTTP/3 goes further by running over QUIC instead of TCP, which cuts the connection setup time and handles packet loss more gracefully, an advantage that shows up most on mobile networks with unstable connections.
Most CDNs, Cloudflare included, and most current hosting stacks support HTTP/2 by default, and a growing share now offer HTTP/3. Check which protocol your site is actually using in Chrome DevTools’ Network tab, add the Protocol column, before assuming you already have it. If you’re still on HTTP/1.1, that’s a hosting or CDN configuration issue worth raising with your provider directly, since it’s rarely something you fix at the application level.
One practical note: once you’re on HTTP/2 or HTTP/3, revisit any old performance advice about domain sharding or asset concatenation built for HTTP/1.1. Some of it actively works against multiplexed connections now.
How should you deliver web fonts without slowing things down?
Fonts cause two separate problems: they delay rendering if loaded incorrectly, and they cause layout shift if the browser swaps a fallback font for the real one after text has already painted.
Fix the render delay first. Self-host font files rather than pulling them from a third-party service where possible, since that removes an extra DNS lookup and connection round-trip. Add <link rel="preload"> for the one or two font files used above the fold, so the browser fetches them early instead of discovering the need mid-render.
Fix the layout shift next with font-display: swap in your @font-face declaration. This shows fallback text immediately and swaps in the custom font once it loads, trading a brief visual change for a much faster First Contentful Paint. The alternative, font-display: block, hides text entirely until the font loads, which is worse for perceived speed on a slow connection.
Cut the number of font files you’re loading. Every weight and style, regular, bold, italic, bold italic, is a separate file. Many sites load six or eight font files for text that could function on two. Variable fonts solve this by packing multiple weights into a single file, which is worth investigating if your design uses more than two or three weights of the same typeface.
Finally, subset your fonts to the character sets you actually need. A font file serving only Latin characters can be a fraction of the size of the full Unicode set.
The part of speed optimization most guides skip
Most speed guides treat every fix as equally urgent, which is backwards. The real skill is ordering fixes correctly and knowing when to stop. A server upgrade that cuts TTFB by 400 milliseconds is worth more than three weeks spent shaving kilobytes off already-small images, yet plenty of “speed checklists” put image compression at the top simply because it’s the easiest thing to demonstrate in a before-and-after screenshot.
The other overrated habit is chasing a perfect Lighthouse score in isolation. A 100 on PageSpeed Insights run once on your machine means very little if your field data from actual visitors still shows a “Needs Improvement” LCP. Lab scores are for catching regressions before you ship; field data is the only number that reflects what your visitors experienced.
If there’s one habit worth adopting from this whole process, it’s treating performance like a metric you revisit monthly, not a project you finish once. Sites regress quietly, through a new plugin, an added tracking pixel, a redesigned banner, and the only way to catch that early is to keep measuring after you think you’re done.
— Shayan Shirvani
Get a performance audit from an experienced business technology consulting firm
Engaging a specialized service can provide a full audit that pinpoints exactly what’s slowing your site down, whether that’s hosting, database bloat, or bloated third-party scripts, before a single change gets made.

A typical engagement starts with a baseline audit covering your Core Web Vitals, TTFB, and waterfall timings on both mobile and desktop. From there, Tech Business Development applies fixes in priority order, hosting and server tuning first, then caching, image, and front-end work, the same sequence covered throughout this guide. Beyond the technical fixes, the team also handles Google services setup like GA4 and Search Console, so you can actually see the before-and-after in your own data rather than taking anyone’s word for it. Faster pages also tend to convert better, since page speed and conversion rate are closely linked.
If your site has been stuck in “Needs Improvement” for months, or you simply don’t have the hours to run monthly Lighthouse audits yourself, start with a performance audit and get a prioritized list of fixes instead of another generic checklist.
Sources
- Understanding Core Web Vitals and Google search results | Google Search Central | Documentation | Google for Developers
- Web
- Performance optimization — WordPress Developer Resources
FAQ
How do I optimize my website speed?
Start by running PageSpeed Insights for both lab and field Core Web Vitals data, then fix issues in order: server response time and hosting first, caching and CDN second, then image and front-end asset work.
What is the ideal load speed for a website?
There’s no single “load time” target anymore; Google grades sites against Core Web Vitals thresholds instead, meaning LCP at 2.5 seconds or less, INP under 200 milliseconds, and CLS under 0.1, measured at the 75th percentile of real visits.
How do you make a web page load faster?
The biggest gains usually come from upgrading slow hosting, adding server-level or CDN caching, compressing and resizing images into WebP or AVIF, and deferring non-critical JavaScript that blocks the main thread.
What is the recommended speed for a website?
Rather than one benchmark number, aim to pass all three Core Web Vitals thresholds, LCP, INP, and CLS, since these are the metrics that determine both user experience and search performance.
Do Core Web Vitals actually affect SEO rankings?
Yes. Core Web Vitals are part of Google’s page experience signals, and a site failing them consistently in field data can see reduced search visibility even with strong content, which is why pairing speed work with a technical SEO audit tends to move both metrics together.